Want to write a function that takes in two data frames with expression data and returns
vector of correlations of matched genes
summary of the correlation vect (min,1Q,median,3Q,max)
returns a list of aligned data frames
plots correlation for a sample of matched genes
print number of individuals in df1 and df2
print number of individuals in common between df1 and df2
print number of genes in common between df1 and df2
print number of genes in df1 not in df2
print number of genes in df2 not in df1
## Rows: 838
## Columns: 14,262
## Delimiter: "\t"
## chr [    2]: FID, IID
## dbl [14260]: ENSG00000187608, ENSG00000188290, ENSG00000160072, ENSG00000162576, ENSG00000187642...
##
## Use `spec()` to retrieve the guessed column specification
## Pass a specification to the `col_types` argument to quiet this message
## Rows: 838
## Columns: 12,816
## Delimiter: "\t"
## chr [ 2]: FID, IID
## dbl [12814]: ENSG00000237491.8, ENSG00000177757.2, ENSG00000225880.5, ENSG00000272438.1, ENSG000...
##
## Use `spec()` to retrieve the guessed column specification
## Pass a specification to the `col_types` argument to quiet this messageComparison function
fn_remove_ver_from_names = function(df)
{
  ind = substr(names(df),1,4) == "ENSG"
  names(df)[ind] = substr(names(df)[ind],1,15)
  df
}


fn_compare_expression_matrices = function(df1, df2, nplots = 4, common_genes=TRUE,plot_dir=NULL)
  {
  ## this function assumes that df1 and df2 have the first two columns named FID and IID"
  ## usage:
  ## tempo_list = fn_compare_expression_matrices(df1, df2, plot_dir="working_dir/plots")
  ## to see plots on screen use the default value plot_dir=NULL by not specifying anything
  ## tempo_list = fn_compare_expression_matrices(df1, df2)
  print(dim(df1))
  print(dim(df2))
  if(!identical(df1$FID, df2$FID) |  !identical(df1$IID, df2$IID) )
  {
    id_tibble <- full_join(hg19[,1:2], amygdala[,1:2])
    print(paste("in total there are ",nrow(id_tibble) , "rows") )
    df1 = left_join(id_tibble, df1, by=c("FID","IID"))
    df2 = left_join(id_tibble, df1, by=c("FID","IID"))
    print(identical(df1$FID, df2$FID))
    print(identical(df1$IID, df2$IID))
    print("the two lines above should say TRUE")
  }
  ## remove version number from ensid
  df1 = fn_remove_ver_from_names(df1)
  df2 = fn_remove_ver_from_names(df2)
  if(common_genes)
  {
    gene_list = intersect(names(df1),names(df2))
    gene_list = gene_list[!(gene_list %in% c("FID","IID"))] ## remove FID, IID
    print(glue::glue("There are {length(gene_list)} genes in common"))
    cor_vec = rep(NA, length(gene_list)); names(cor_vec) = gene_list
    for(gg in gene_list)
    {
      cor_vec[gg] = cor(df1[[gg]],df2[[gg]])
    }
    print(summary(cor_vec))
    for(pp in 1:nplots) {
      gg = sample(gene_list,1)
      if(!is.null(plot_dir)) png(glue::glue("{plot_dir}/{gg}_df1_vs_df2.png"))
      plot(df1[[gg]],df2[[gg]],main=paste(gg," - cor = ",round(cor_vec[gg]),2))
      if(!is.null(plot_dir)) dev.off()
    }
    if(!is.null(plot_dir)) png(glue::glue("{plot_dir}/hist_cor_df1_vs_df2.png"))
    hist(cor_vec,main="correlation between df1 and df2")
    if(!is.null(plot_dir)) dev.off()
  } else ## below is just testing, 10K by 10K is too large
  if(ncol(df1)*ncol(df2)<2e6){
    mat1 = scale( as.matrix(df1 %>% select(-c("FID","IID")) ) )
    mat2 = scale(as.matrix(df2 %>% select(-c("FID","IID")) ) )
    cor_mat = t(mat1) %*% mat2 / nrow(mat1)
  }
  list(df1,df2,cor_vec)
}

tempo_list = suppressWarnings(fn_compare_expression_matrices(df1, df2) )
## [1] 838 14262
## [1] 838 12816
## There are 8557 genes in common
## Min. 1st Qu. Median Mean 3rd Qu. Max. NA's
## -0.98801 0.05389 0.36561 0.37017 0.74258 1.00000 11


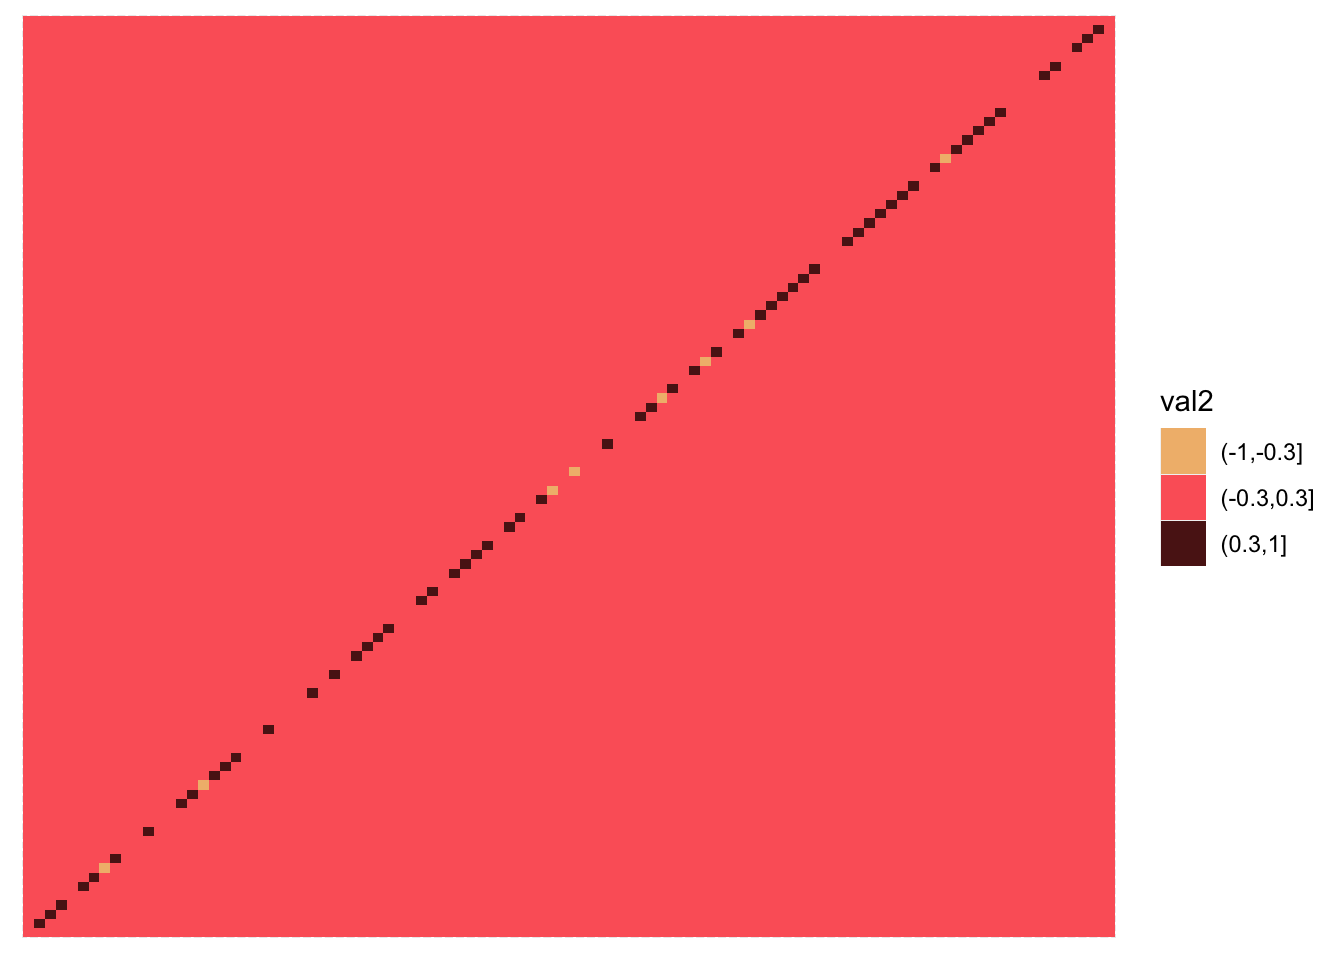
Calculated correlation all genes agains all genes. Thsi cannot be done for all the genes, so I’m using a subset of 100 or so.
suppressMessages(library(wesanderson))


tileplot <- function(mat,no_label=FALSE)
{
  mat = data.frame(mat)
  mat$Var1 = factor(rownames(mat), levels=rownames(mat)) ## preserve rowname order
  melted_mat <- gather(mat,key=Var2,value=value,-Var1)
  melted_mat$Var2 = factor(melted_mat$Var2, levels=colnames(mat)) ## preserve colname order
  rango = range(melted_mat$value)
  melted_mat$val2 = cut(melted_mat$value,breaks=c(-1,-0.3,0.3,1))
  pp <- ggplot(melted_mat,aes(x=Var1,y=Var2,fill=val2)) + geom_tile() ##+scale_fill_gradientn(colours = c("#C00000", "#FF0000", "#FF8080", "#FFC0C0", "#FFFFFF", "#C0C0FF", "#8080FF", "#0000FF", "#0000C0"), limit = c(-1,1))
  if(no_label)
    pp <- pp +
    theme(axis.title.x=element_blank(),
          axis.text.x=element_blank(),
          axis.ticks.x=element_blank(),
          axis.title.y=element_blank(),
          axis.text.y=element_blank(),
          axis.ticks.y=element_blank()) +
    scale_fill_manual(values = wes_palette("GrandBudapest1", n = 3))
          #scale_fill_brewer(palette = "Dark2")
          # scale_fill_gradientn( colours=rainbow(5),limit=c(-1,1) )
##    scale_fill_gradient( limits = c(-.5,.5),low =  "blue", high = "red", na.value="black")
  print(pp)
}


  df1 = fn_remove_ver_from_names(df1)
  df2 = fn_remove_ver_from_names(df2)

t_genelist = sample(intersect(colnames(df1[,-c(1:2)]),colnames(df2[,-c(1:2)])),100)
    mat1 = scale( as.matrix(df1[,t_genelist]  ) )
    mat2 = scale(as.matrix(df2[,t_genelist]  ) )
cor_mat = t(mat1) %*% mat2 / nrow(mat1)
tileplot(cor_mat,no_label=TRUE)